From January 23 (Thursday), the congestion level of Ginza Line Shibuya Station will be distributed using Train Vision®
Tokyo Subway Co., Ltd. is promoting visualization of the congestion situation. One of the initiatives is a demonstration experiment that displays the degree of congestion at the Ginza Line Shibuya Station premises on the Ginza Line in-car display (hereinafter "Train Vision®"). , Starting on Thursday, January 23, 2020.
Tokyo Metro is making efforts to visualize congestion status, such as providing congestion degree information for each train on the Tokyo Metro homepage, etc., so that customers can be notified of the congestion status in advance so that they can use the railway more comfortably. Out.
This time, in order to understand the usefulness of the technology for analyzing the congestion degree and the optimal information distribution method, etc., to further visualize the congestion situation, the congestion degree in the station premises of Ginza Line Shibuya Station was added to the Ginza Line Train Vision ® Perform a demonstration experiment to display.
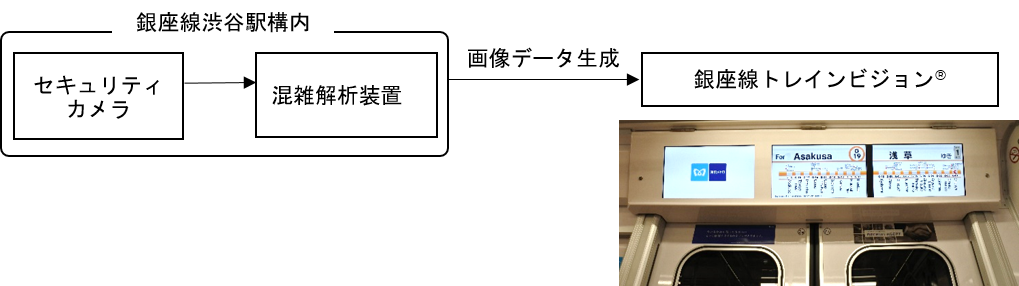
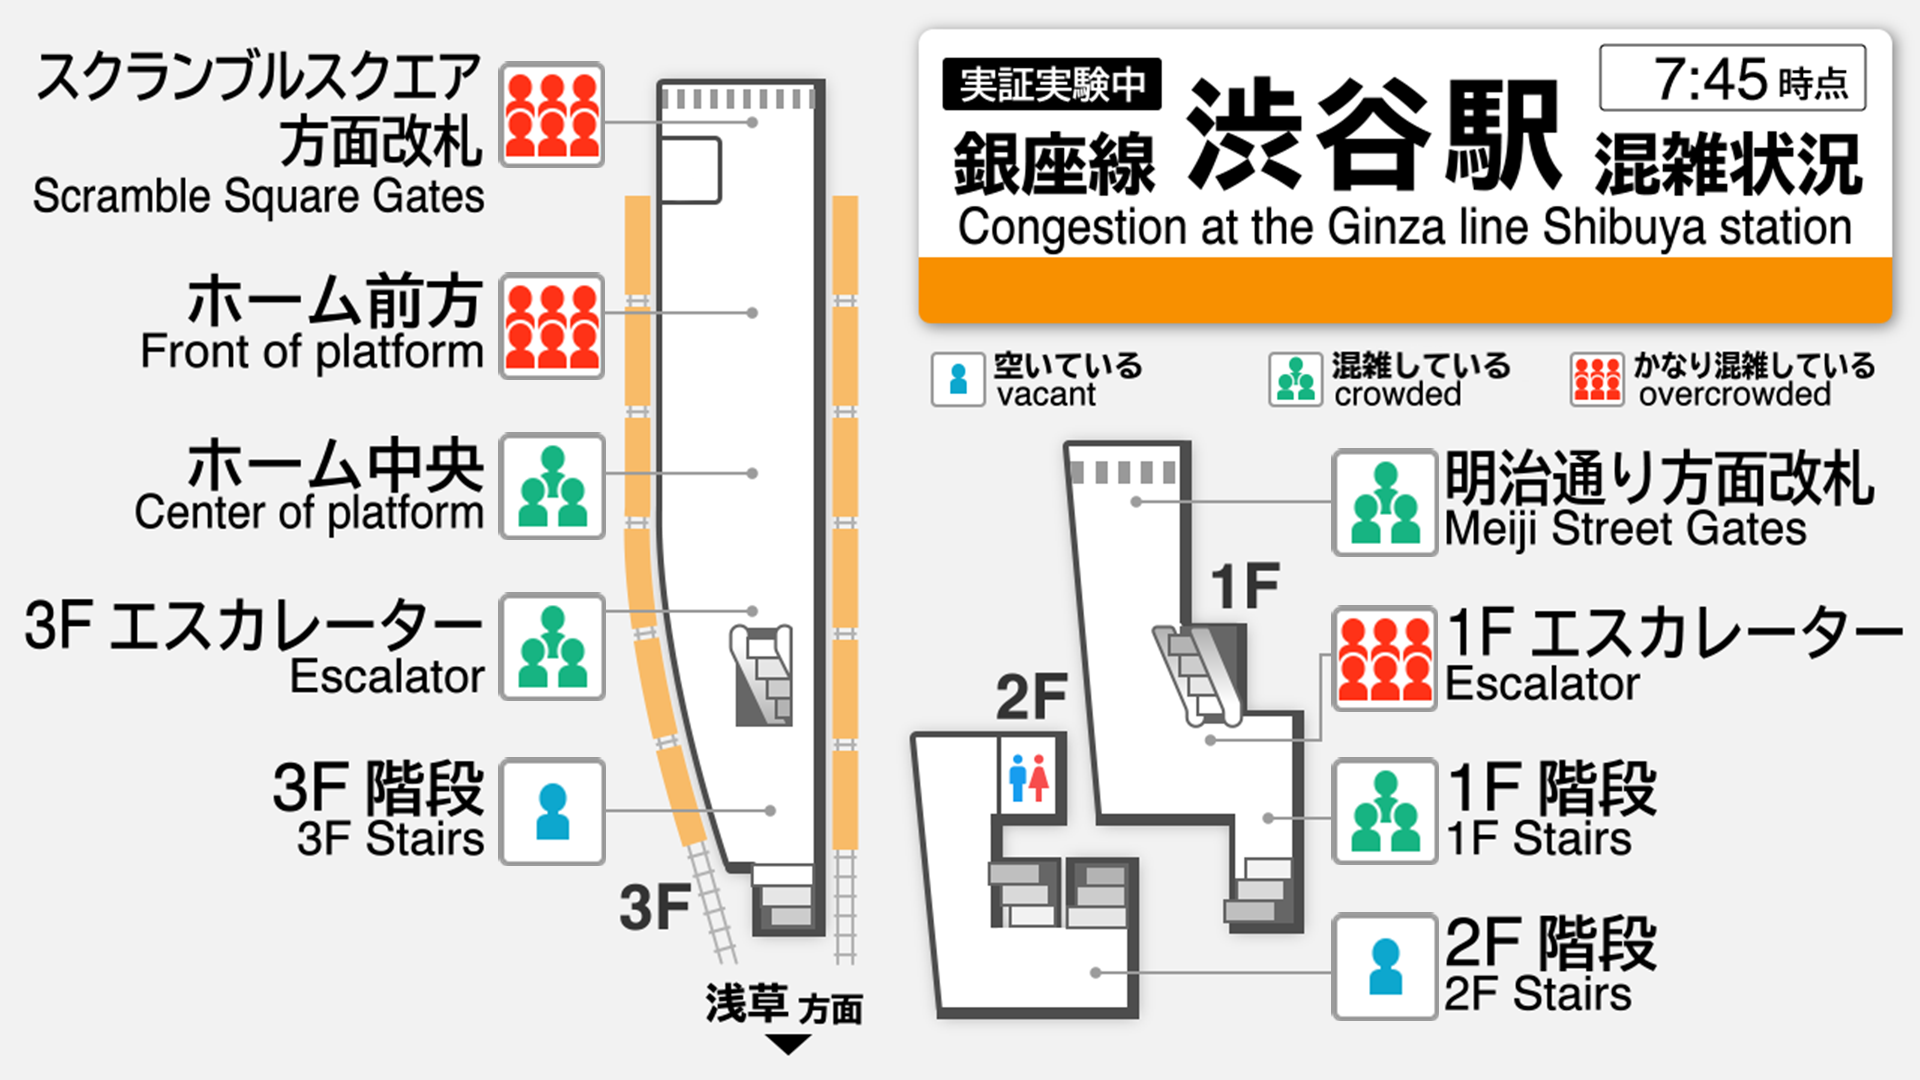
Automatically analyzes the degree of congestion from the security camera image inside Shibuya Station yard, and calculates the congestion degree of the main places indicated in three stages (“vacant,” “congested,” “very congested”) in Ginza Delivered via Line Train Vision®.
This is the first attempt in Japan to display the congestion level of a station in a vehicle using the congestion level automatic analysis technology.
In the future, we will further visualize the congestion situation based on the results of this demonstration experiment.
Congestion level display demonstration experiment at Ginza Line Shibuya Station
1. Outline and purpose of this demonstration experiment [Overview]
Automatically analyzes security camera images of Ginza Line Shibuya Station, creates image data showing the degree of congestion on the station map, and distributes it to Ginza Line Train Vision®.
【Purpose】
・ Confirmation of usefulness of technology to automatically analyze congestion degree ・ Study of suitable distribution means for congestion degree information
2 Experiment start date and target route (section)
[Experiment start date] Thursday, January 23, 2020
[Applicable routes (sections)] All Ginza Lines * Displayed sections may be changed depending on the status of demonstration experiments.
3 Experimental environment
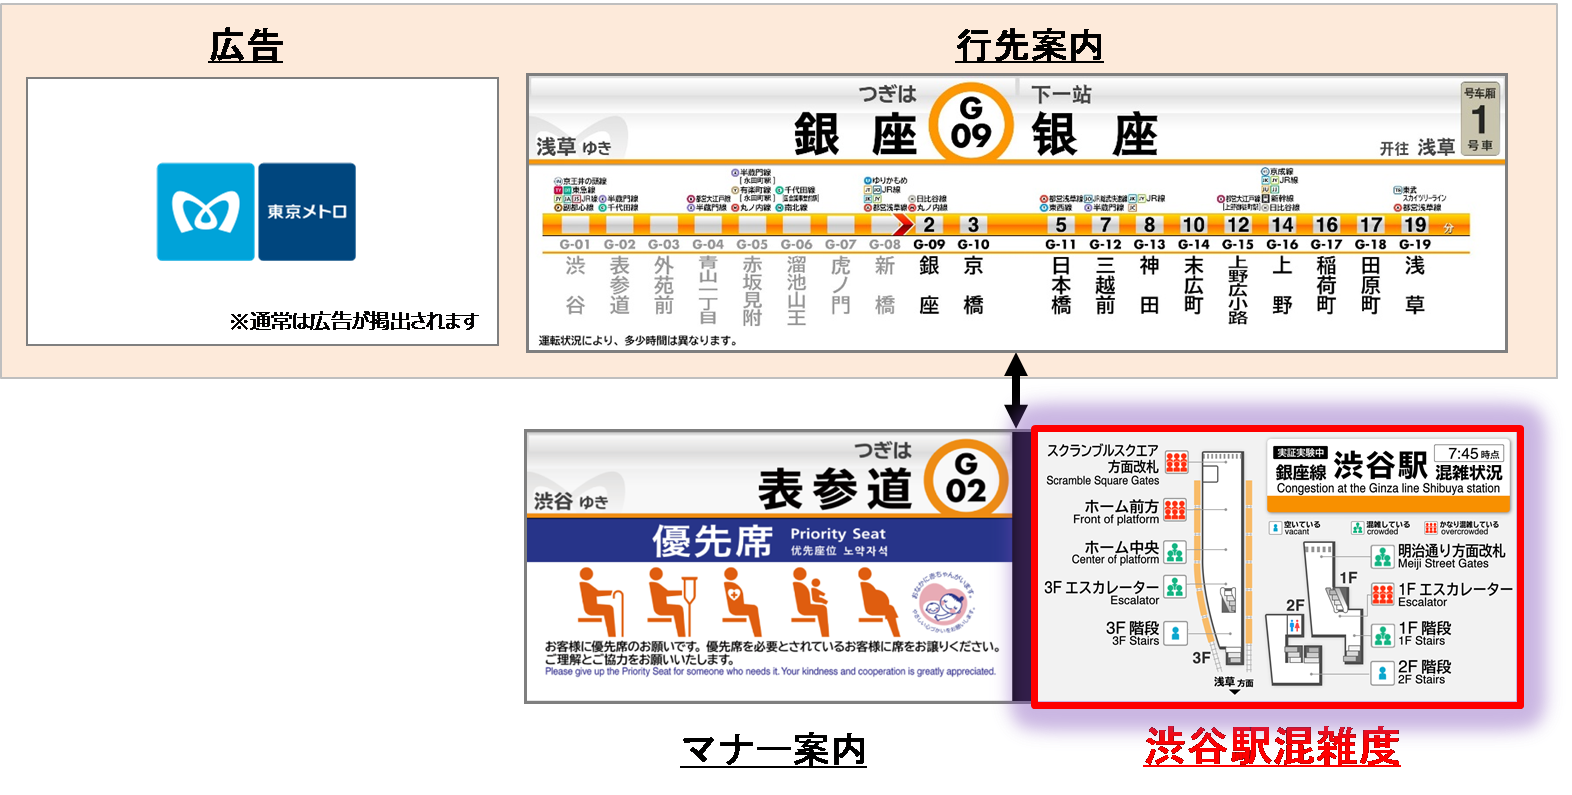
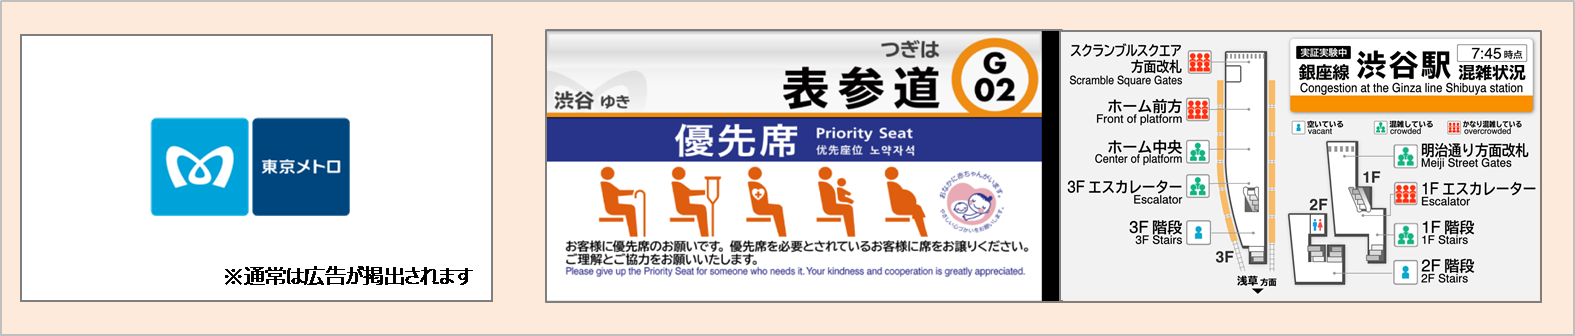
4 Congestion degree display in TrainVision® (1) Congestion degree information The congestion degree of major places in the Ginza Line Shibuya Station premises is classified into three levels (“vacant,” “congested,” “ Yes ").
screen image
(2) Opportunities for displaying congestion degree information Congestion degree information is displayed along with etiquette information following destination information, station platform information, news, etc.
(3) Update frequency of congestion degree information Shibuya Station congestion degree information is updated when "Asakusa Station", "Ueno Station", and "Omotesando Station" stop.

5. Future study <br /> Based on the results of this demonstration experiment, etc., we will consider the distribution of congestion using various technologies and distribution methods to further visualize the congestion.
6 Others (1) Handling of camera data The security camera video data used for displaying the congestion level is converted to image data for displaying the congestion level that does not identify any individual and displayed. In addition, using a congestion analyzer that cannot be accessed from the outside, data is automatically deleted after the analysis is completed.
(2) Discontinuation of distribution Due to various circumstances, distribution may be suspended without notice. Please note.
* "Train Vision®" is a registered trademark of Mitsubishi Electric Corporation.